

San Diego Real Estate in 2026: A Year-to-Date Wrap-Up and What to Expect in 2027
/By Morgan Craft, Founder and Lead Property Stylist, CASA BY CRAFT. Published October 2026. Market data is through September 2026 unless noted.
Short answer: Through September, San Diego County's 2026 market looks a lot like 2025, with a higher price tag. The year-to-date median sale price is $925,000 (up 2.8%), closed sales are flat at 17,318 (up 0.6%), and homes took 39 days to reach an accepted offer versus 38 last year. Against the 10-year average, prices are about 32% higher, sales are about 27% lower and homes take about 10 days longer to sell. The wild card is mortgage rates: Freddie Mac's 30-year average hit 7.40% on October 15 (6.27% a year ago), and September pending sales fell 15.9%. Forecasts for 2027 point to little price growth and, at best, a modest sales recovery.
Some years roar. Some years just show up and ask for your best work.
If you are an agent or a seller wondering whether now is a good time to list, here is a plain-spoken look at where the market stands, how it compares with 2025 and with the last ten years, what the major forecasters expect for the rest of 2026 and 2027, and what it means if you are getting a home ready to sell. Every number below links to its source, and anything that is a prediction is labeled as one.
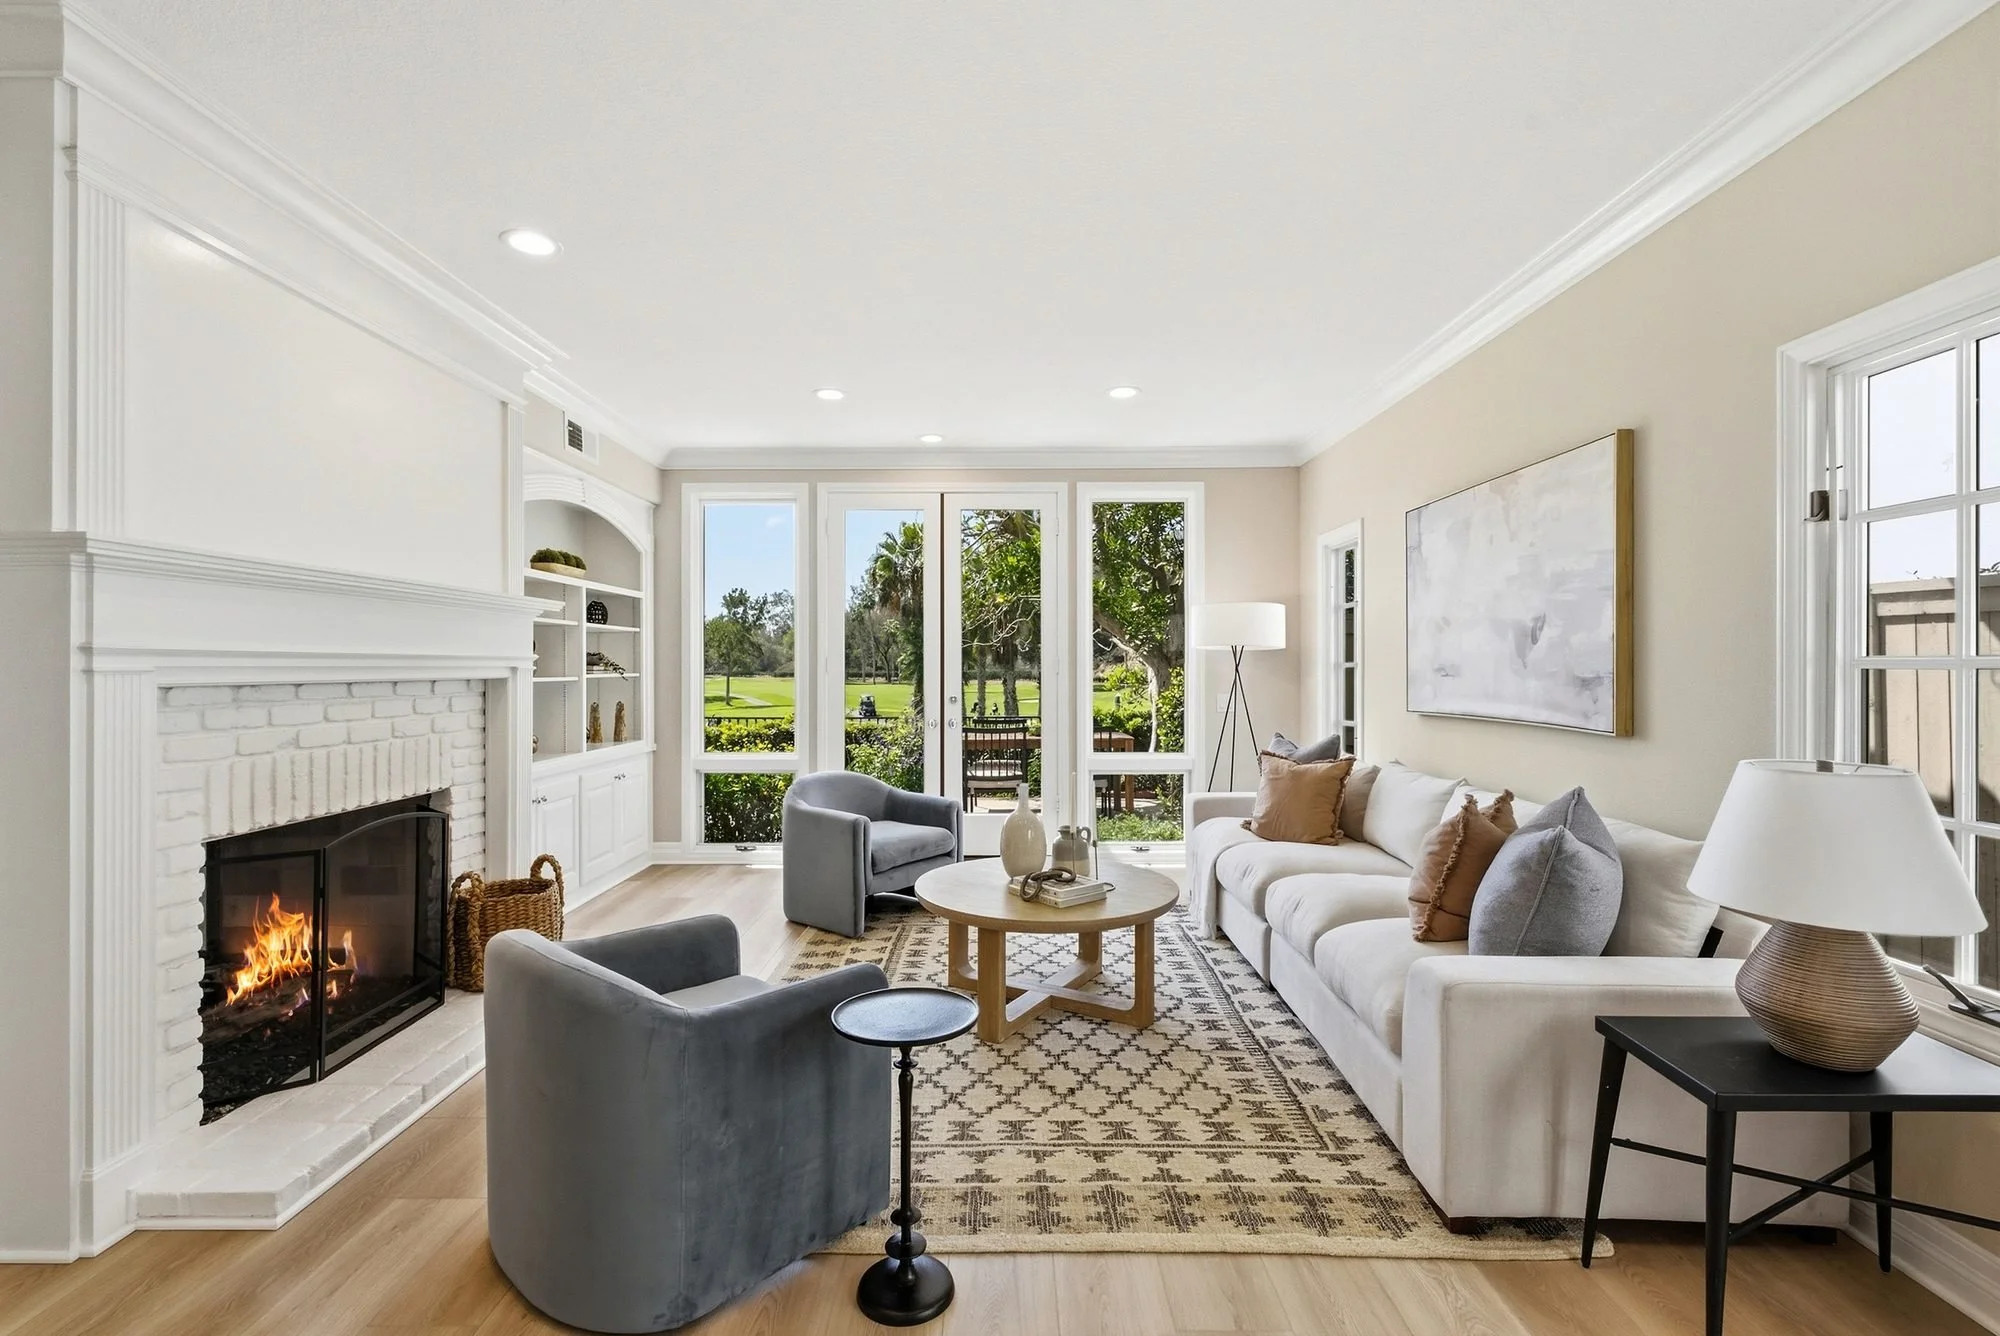
Presentation is the part of a sale you control. A warm, bright living room like this one, styled by CASA BY CRAFT, is what buyers remember from the listing photos.
How 2026 compares with 2025 and the 10-year average
The numbers below cover all residential sales (houses, condos and townhomes) in San Diego County, as reported by the Greater San Diego Association of REALTORS® (SDAR) September 2026 Monthly Indicators, current as of October 5, 2026. "Year to date" means January through September.
| Metric | 2026 year to date | 2025 year to date | 10-year average (2016 to 2025) |
|---|---|---|---|
| Median sale price | $925,000 | $900,000 | about $700,000 |
| Closed sales | 17,318 | 17,223 | about 23,800 |
| Days on market until sale (listing to accepted offer) | 39 | 38 | about 29 |
| Percent of original list price received | 98.2% | 97.9% | about 99.2% |
How the 10-year average was calculated: for each year from 2016 through 2025, I took the January-to-September figure from SDAR's September Monthly Indicators report (2017, 2019, 2021, 2023 and 2025; each report shows two years) and added up the ten values and divided by ten. For 2025 I used the figure restated in the 2026 report. Prices are not adjusted for inflation, and the median figure is an average of ten yearly medians. SDAR restates older numbers as late data arrives, so treat the averages as close, not exact.
What the table says in plain English:
Prices are holding at a high level. The year-to-date median is 2.8% above 2025 and about 89% above the $490,000 year-to-date median of 2016. It is also far above the 10-year average because of the 2020 to 2022 run-up.
Volume is still low. Closed sales are essentially level with 2025, but about 27% below the 10-year average. In 2021 SDAR counted 30,144 closed sales through September; this year it is 17,318.
Homes take a little longer than they used to. At 39 days, the average is about ten days slower than the 10-year average, and one day slower than last year.
Sellers are still getting close to asking. Homes sold for 98.2% of their original list price, slightly better than 2025 and about one point below the 10-year average, which includes the 2021 and 2022 bidding wars (when the figure was above 102%).
Prices: higher, but barely moving
The story depends on the kind of home. Year to date, the SDAR median for detached houses is $1,100,000, up 3.3% from 2025. For attached homes (condos and townhomes) it is $665,000, down 0.7%. In September alone, the all-property median was $910,000, up 1.7% from September 2025, with detached homes at $1,079,000 (up 5.8%) and attached at $670,000 (down 0.2%).
Other trackers agree that price growth is modest. Zillow's typical home value for the San Diego metro was $926,961 at the end of September, up about 0.8% from a year earlier (calculated from Zillow's published home value data). Redfin reports a median sale price of $979,000 for the City of San Diego over the three months ending in September, up 3.4% (Redfin). Different tools measure different things, so the numbers differ, but none of them shows a big move in either direction.
Inventory and new listings: fewer houses, more condos
Supply tells the sharpest story this year. Year to date, new listings are down 5.5% countywide to 28,642, but that is a tale of two property types: new detached listings are down 10.0% (16,681), while new attached listings are up 1.6% (11,961). At the end of September there were 5,684 homes for sale in the county, down 4.8% from a year ago. Detached inventory was 2,950 (down 12.9%) and attached inventory was 2,734 (up 5.8%).
SDAR's months of supply was 3.0 overall in September, versus 3.1 a year earlier. Detached homes had 2.4 months of supply and condos and townhomes had 4.0. By the usual rule of thumb, lower supply favors sellers, so detached homes still lean that way and condos are more balanced. For context, SDAR's September months of supply averaged about 2.1 over the last ten Septembers as published at the time (2.4, 1.8, 2.9, 2.3, 1.8, 0.8, 1.8, 1.7, 2.3 and 3.1 for 2016 through 2025), so the market is more supplied than the typical recent year but nowhere near a glut. SDAR restates inventory counts over time, so I did not calculate a 10-year average for homes for sale.
Realtor.com's September report puts the San Diego metro's active listings down 1.5% from last year, with 20.4% of listings carrying a price cut (up 0.6 percentage points) and a median list price of $888,450 (Realtor.com September 2026 Monthly Housing Trends). Nationally, 20.8% of listings had a price cut in September, the highest September share since 2018.
Speed and negotiating room
Through September, homes needed 39 days on average to reach an accepted offer, up from 38. Detached homes held at 36 days, the same as 2025, while attached homes slowed from 40 to 44 days. In September, the all-property figure was 39 days, down from 41 a year earlier.
On the City of San Diego side, Redfin shows a median of 28 days on market (compared with 34 last year), an average sale-to-list ratio of 99.0%, 32.7% of homes selling above list price and 34.3% of listings with a price drop. Redfin measures against the final list price and SDAR measures against the original list price, which is why the two percentages differ. Read together: well-priced homes are still moving, and a lot of sellers are adjusting their price along the way.
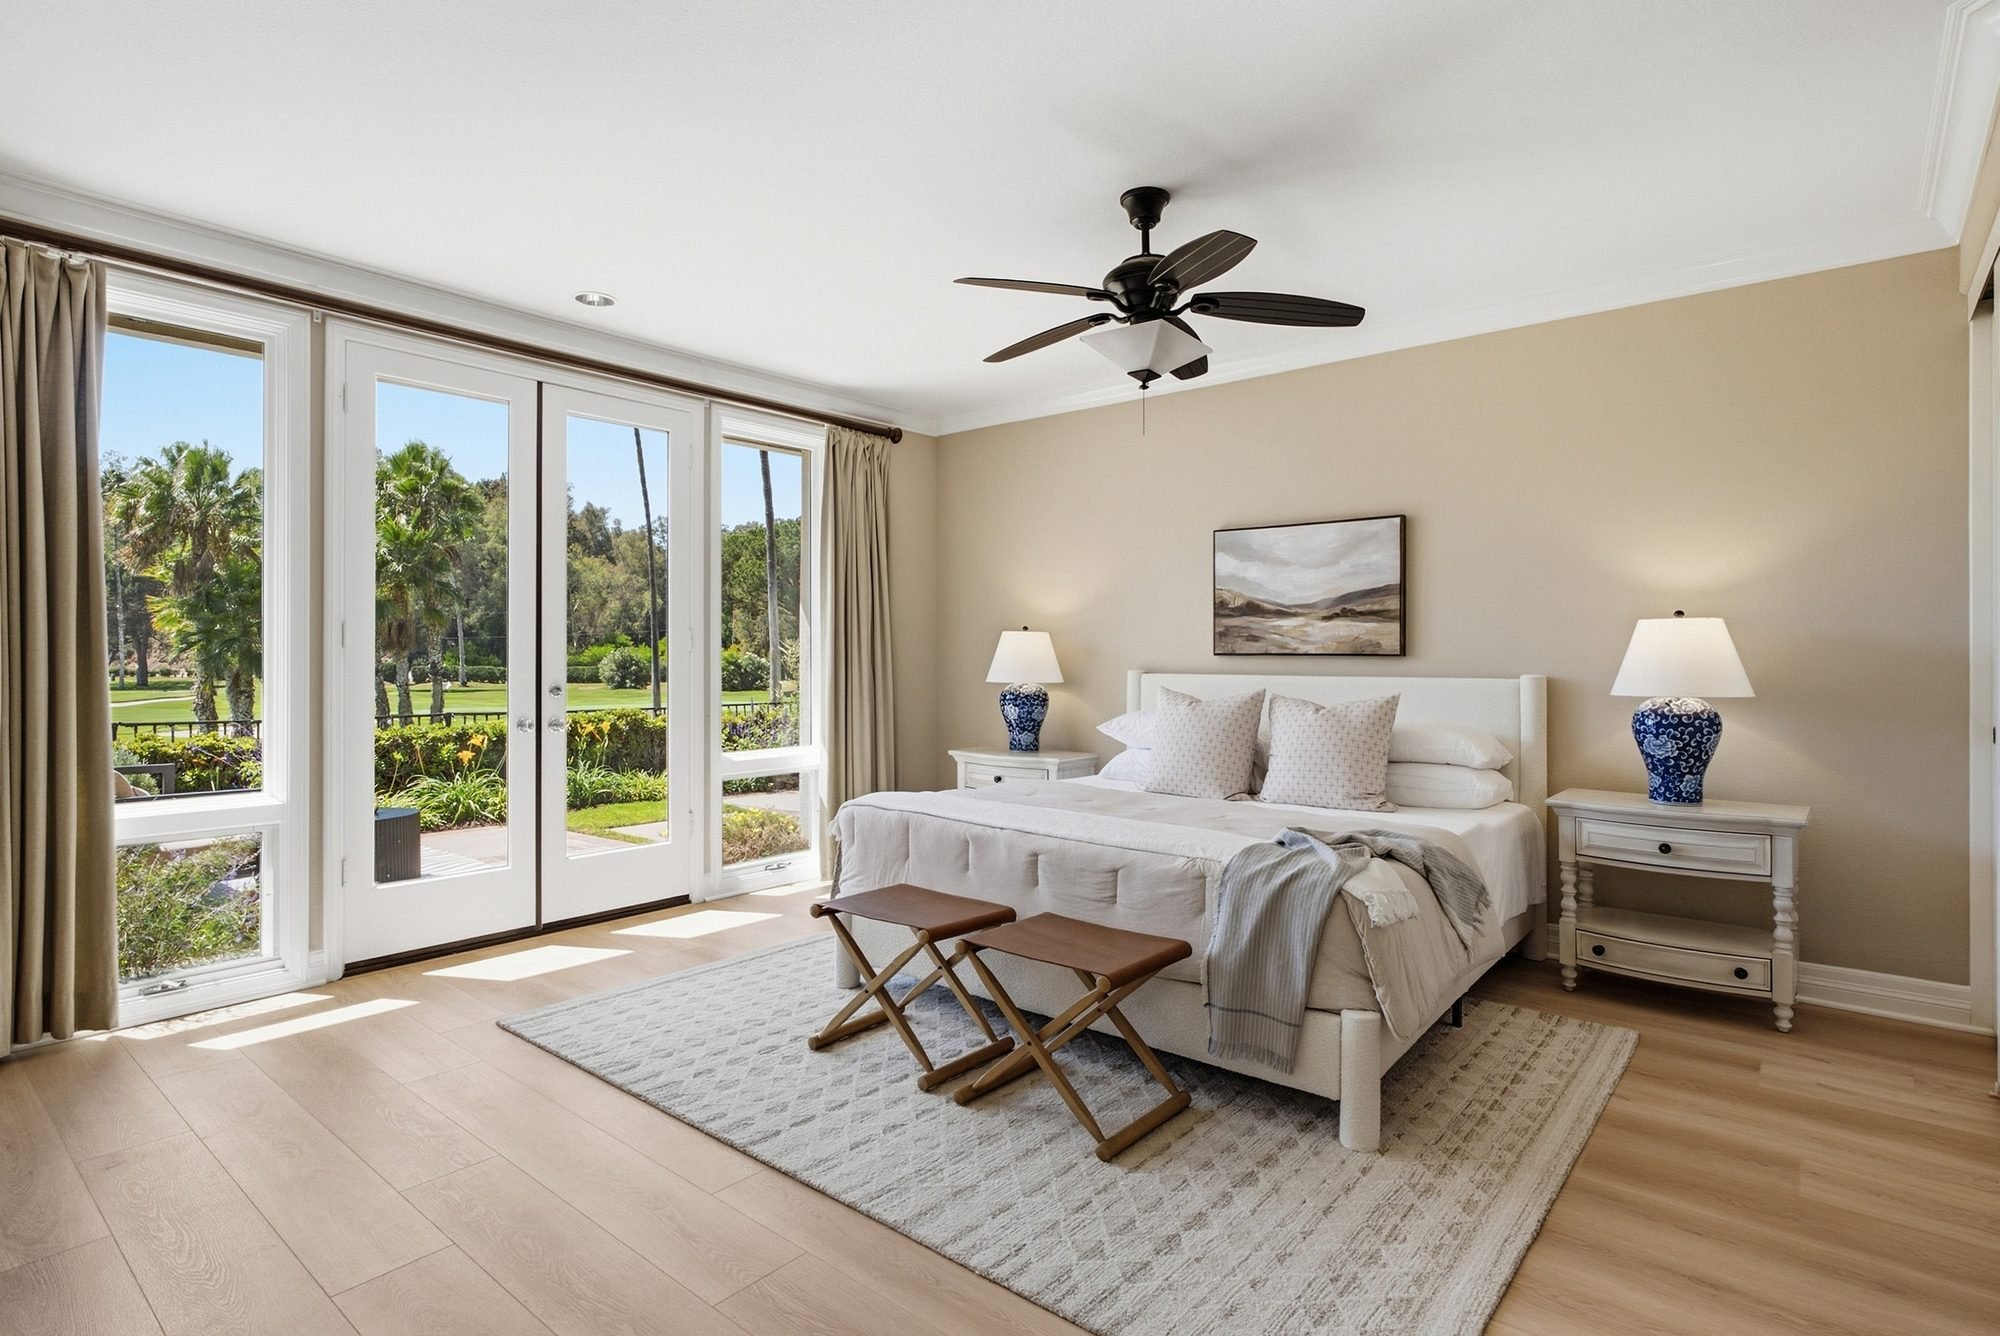
When homes take about 39 days to reach an accepted offer, a calm, move-in-ready bedroom helps a listing hold buyers’ attention.
Mortgage rates: the swing factor
Freddie Mac's Primary Mortgage Market Survey put the 30-year fixed rate at 7.40% on October 15, 2026, unchanged from the week before and up from 6.27% a year earlier. The Associated Press reported that is the highest level since November 2023.
It was not like that all year. Using Freddie Mac's weekly data (as published by the St. Louis Fed's FRED database), the 2026 average from January 1 through October 15 is 6.48%, slightly below 6.71% over the same weeks of 2025. Rates dipped to 5.98% in late February, then climbed. For context, the average over the same January-to-mid-October window in each of the ten years from 2016 to 2025 is 4.73% (my calculation from the same weekly series). The ten-year average is dragged down by the 2020 and 2021 lows, but it shows why many owners feel locked in.
The rise since late summer lines up with what SDAR shows. In September, pending sales (accepted offers) fell 15.9% year over year and closed sales fell 14.0%. SDAR's Housing Affordability Index for San Diego County slipped to 45 year to date from 49 a year ago; by SDAR's definition, an index of 45 means the median household income is 45% of what is needed to qualify for the median-priced home. The Mortgage Bankers Association cites persistent inflation, rising energy prices and a 25-basis-point Federal Reserve rate hike in September, and the Realtor.com September report points to geopolitical uncertainty as well.
What forecasters expect for the rest of 2026 and for 2027
These are forecasts, not facts, and several were published before rates reached 7.40%. They are listed by publication date, and each is labeled with who made it.
California Association of REALTORS® (C.A.R.), October 7, 2026: For California as a whole, a 2026 median single-family price of $882,200 (up 0.8%) and a 2027 median of $894,400 (up 1.4%). Existing single-family sales of 268,100 in 2026 (down 1.1%) and 277,900 in 2027 (up 3.7%). C.A.R. assumes a 6.6% average mortgage rate in 2027, which is lower than today's rate, so its sales forecast looks optimistic if rates stay near 7.4%. C.A.R.'s chief economist expects the market to stay subdued through the end of 2026. This is a statewide forecast, not a San Diego one. Source: C.A.R. 2027 California Housing Market Forecast.
Zillow, forecast data dated September 30, 2026: For the San Diego metro, typical home values down 0.4% by the end of December 2026 and up 0.9% by September 2027 (the U.S. is forecast up 1.1% over the same period; source: Zillow forecast data). Zillow's September 18 forecast expects national existing home sales to fall 3.5% year over year in the fourth quarter and inventory to rise 10.1%.
Mortgage Bankers Association (MBA), October 11, 2026: The 30-year mortgage rate averaging 7.3% in the fourth quarter of 2026 and staying above 7% through 2027 (7.1% to 7.2% in each 2027 quarter). National existing-home sales of 4.090 million in 2027 versus 4.081 million in 2026, and home price growth that slows in 2027 before picking up in 2028. Source: MBA Mortgage Finance Forecast.
Fannie Mae Economic and Strategic Research, October 12, 2026: A 7.5% average 30-year rate in 2027 and total home sales of 4.713 million in 2027 (up 0.9%). Its September forecast had assumed 6.7% and 4.882 million sales, which shows how quickly forecasts are moving with rates. Source: Fannie Mae Housing Forecast, October 2026.
National Association of REALTORS® (NAR), October 2026: NAR Chief Economist Lawrence Yun said this month that he now expects 2026 existing-home sales to rise no more than 2% and prices to rise about 2%, and that it is too early to make a 2027 forecast, according to the Las Vegas Review-Journal. He said that if mortgage rates are closer to 6% at the start of 2027, there would be good buying activity. His June forecast was 4% growth in both sales and prices.
Realtor.com, July 8, 2026: The midyear forecast called for 1.2% national price growth and 4.10 million existing-home sales in 2026, with a 6.3% average mortgage rate. Rates have since run higher. I did not find a 2027 forecast from Realtor.com as of October 18, 2026.
Not available: I did not find a published 2027 forecast from SDAR or a 2027 national forecast from Redfin as of October 18, 2026, so they are left out rather than guessed at.
What the forecasts have in common: slow, low-single-digit price growth, modest sales improvement at best, and a heavy dependence on mortgage rates. The range for rates alone runs from about 6.6% (C.A.R.) to 7.5% (Fannie Mae).
The CASA BY CRAFT perspective
This section is opinion, not data. It is how I read the numbers as a stager who works in San Diego listings every week.
This looks like a slower market, not a broken one. Prices are still edging up, and the average home still sells for more than 98% of its original asking price. But volume is far below the 10-year average, and September's drop in accepted offers suggests fewer buyers are showing up for each new listing as we head into winter.
Expect a quieter rest of 2026. Accepted offers in September were down almost 16%, and accepted offers become closed sales a month or two later, so I would expect softer closed-sales numbers in October and November. That is my inference, not a forecast from a named source.
Spring 2027 is decided by rates, and nobody knows. The forecasts range from "modest recovery" to "little change." Listing agents who prepare homes in January and February, rather than waiting for a rate signal, will be in front of buyers when they do show up.
Detached and attached homes are different markets. Houses are in short supply, so they still sell faster. Condos and townhomes have more inventory, more price cuts and longer days on market. A condo needs to look better than the one next door.
What this means for sellers and listing agents
Price it for today, not for last spring. About one in five San Diego listings carried a price cut in September, according to Realtor.com. Pricing correctly on day one avoids a stale listing.
Set timeline expectations early. SDAR's 39-day average is the time from listing to an accepted offer, which is roughly five and a half weeks before escrow even starts.
Do not rely on a rate drop. The forecasts above do not agree on whether rates will fall in 2027, so a seller who has to move should not wait for one.
Presentation is the part you control. You cannot change the mortgage rate or the inventory. You can change how a home looks in the first photo.
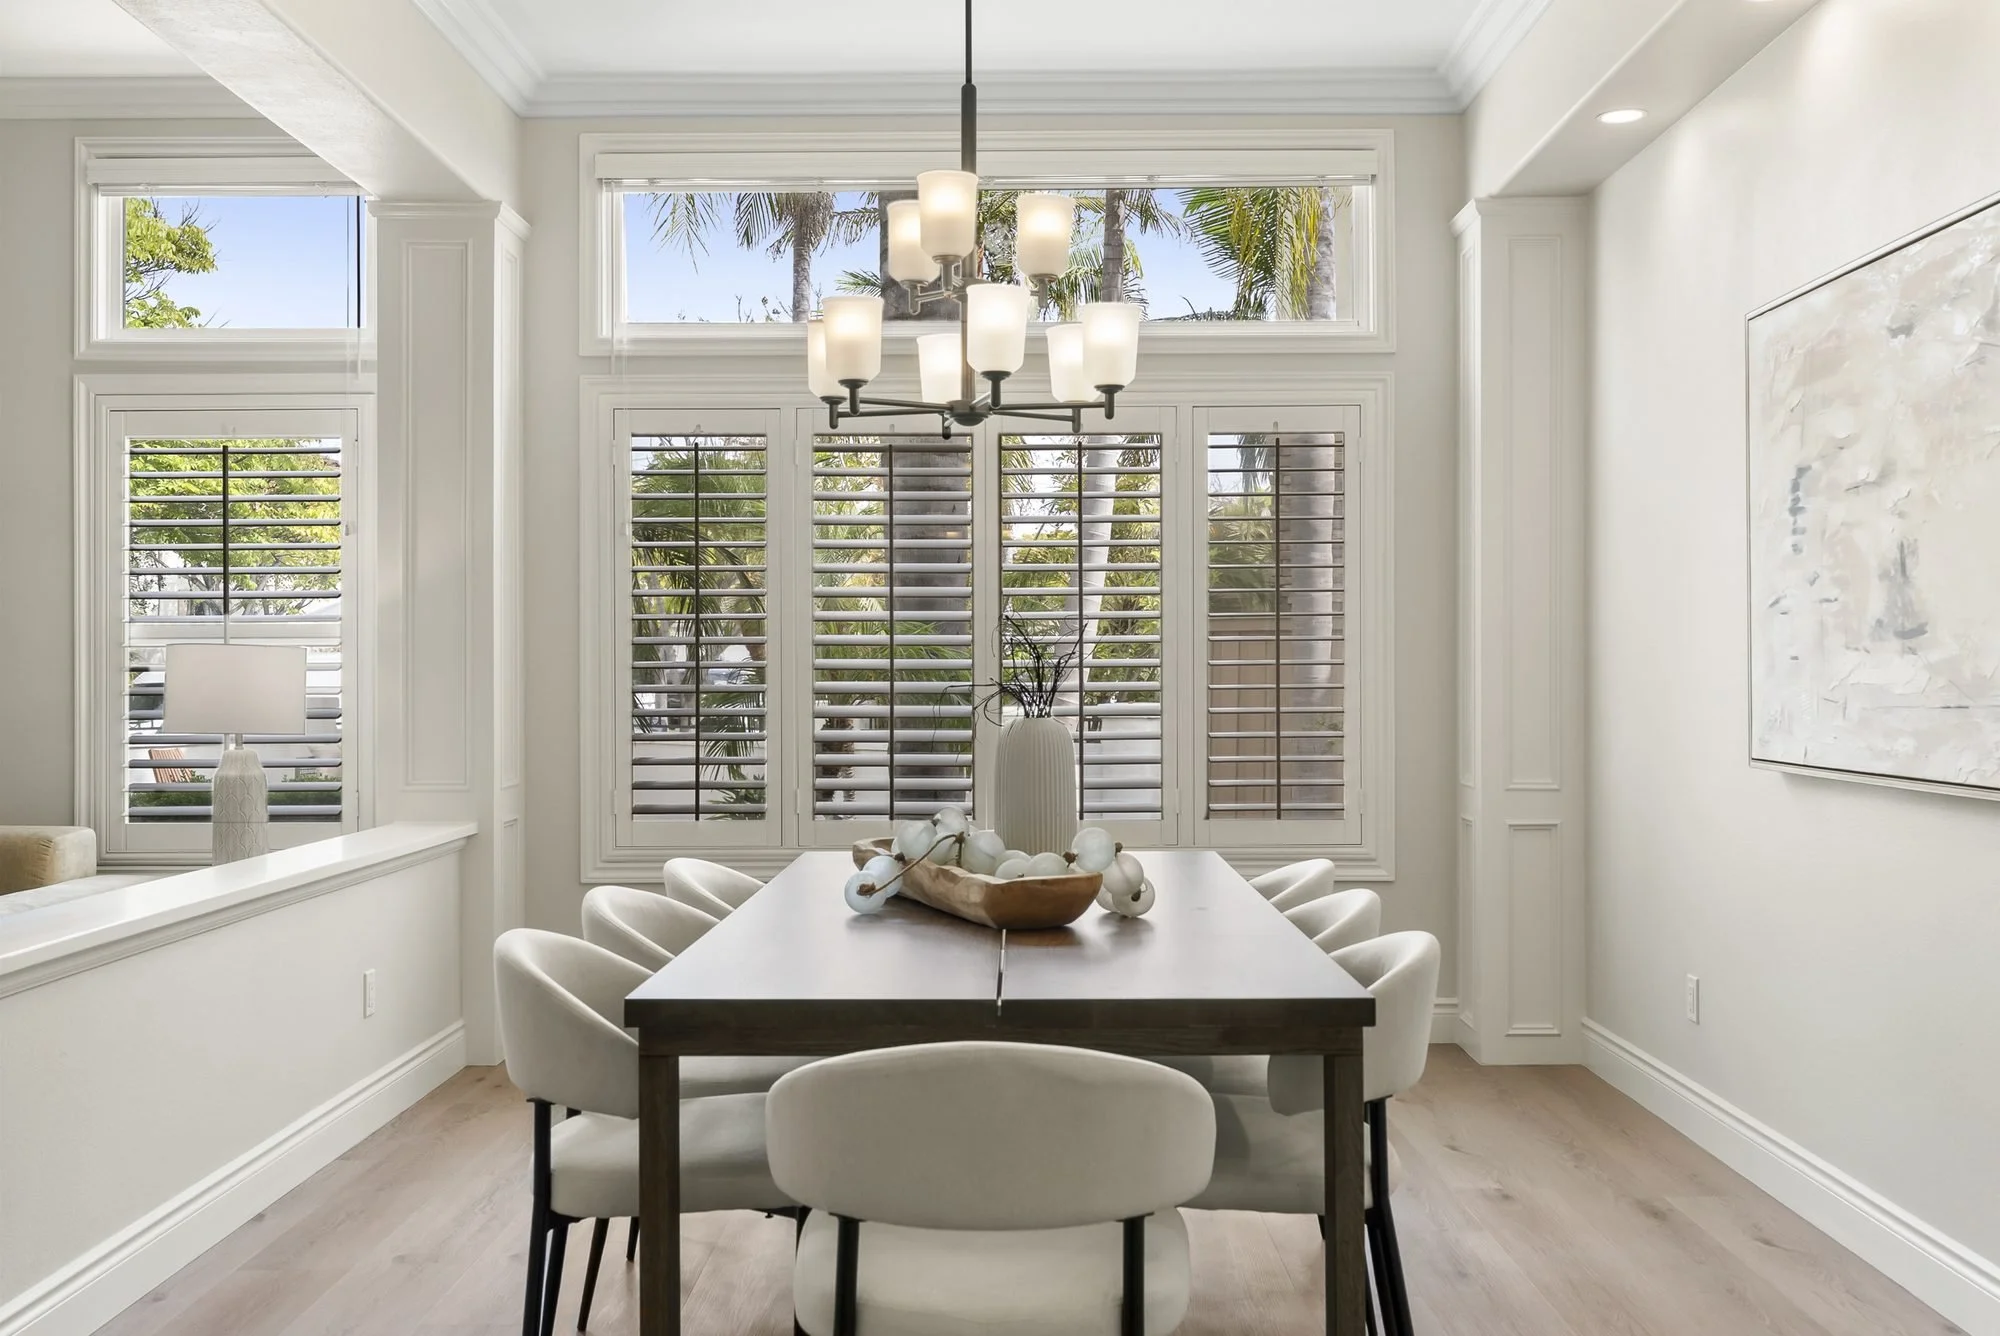
The dining room at 5439 Harvest Run Dr, a CASA BY CRAFT staging. Buyers see a place to gather, not an empty room.
Why staging matters in a market like this
When buyers are scarce and choosy, the listing has to do more work. Nationally, in the National Association of Realtors' 2025 Profile of Home Staging, 83% of buyers' agents said staging made it easier for buyers to picture the property as a future home, 29% of sellers' agents reported a 1% to 10% increase in the dollar value offered, and 49% said staging reduced the time a home spent on the market. Those are national survey results and individual outcomes vary, but they point in the same direction as the local numbers above: in a market with 39-day average selling times and one in five listings cutting price, a home that photographs well and feels move-in ready has an edge.
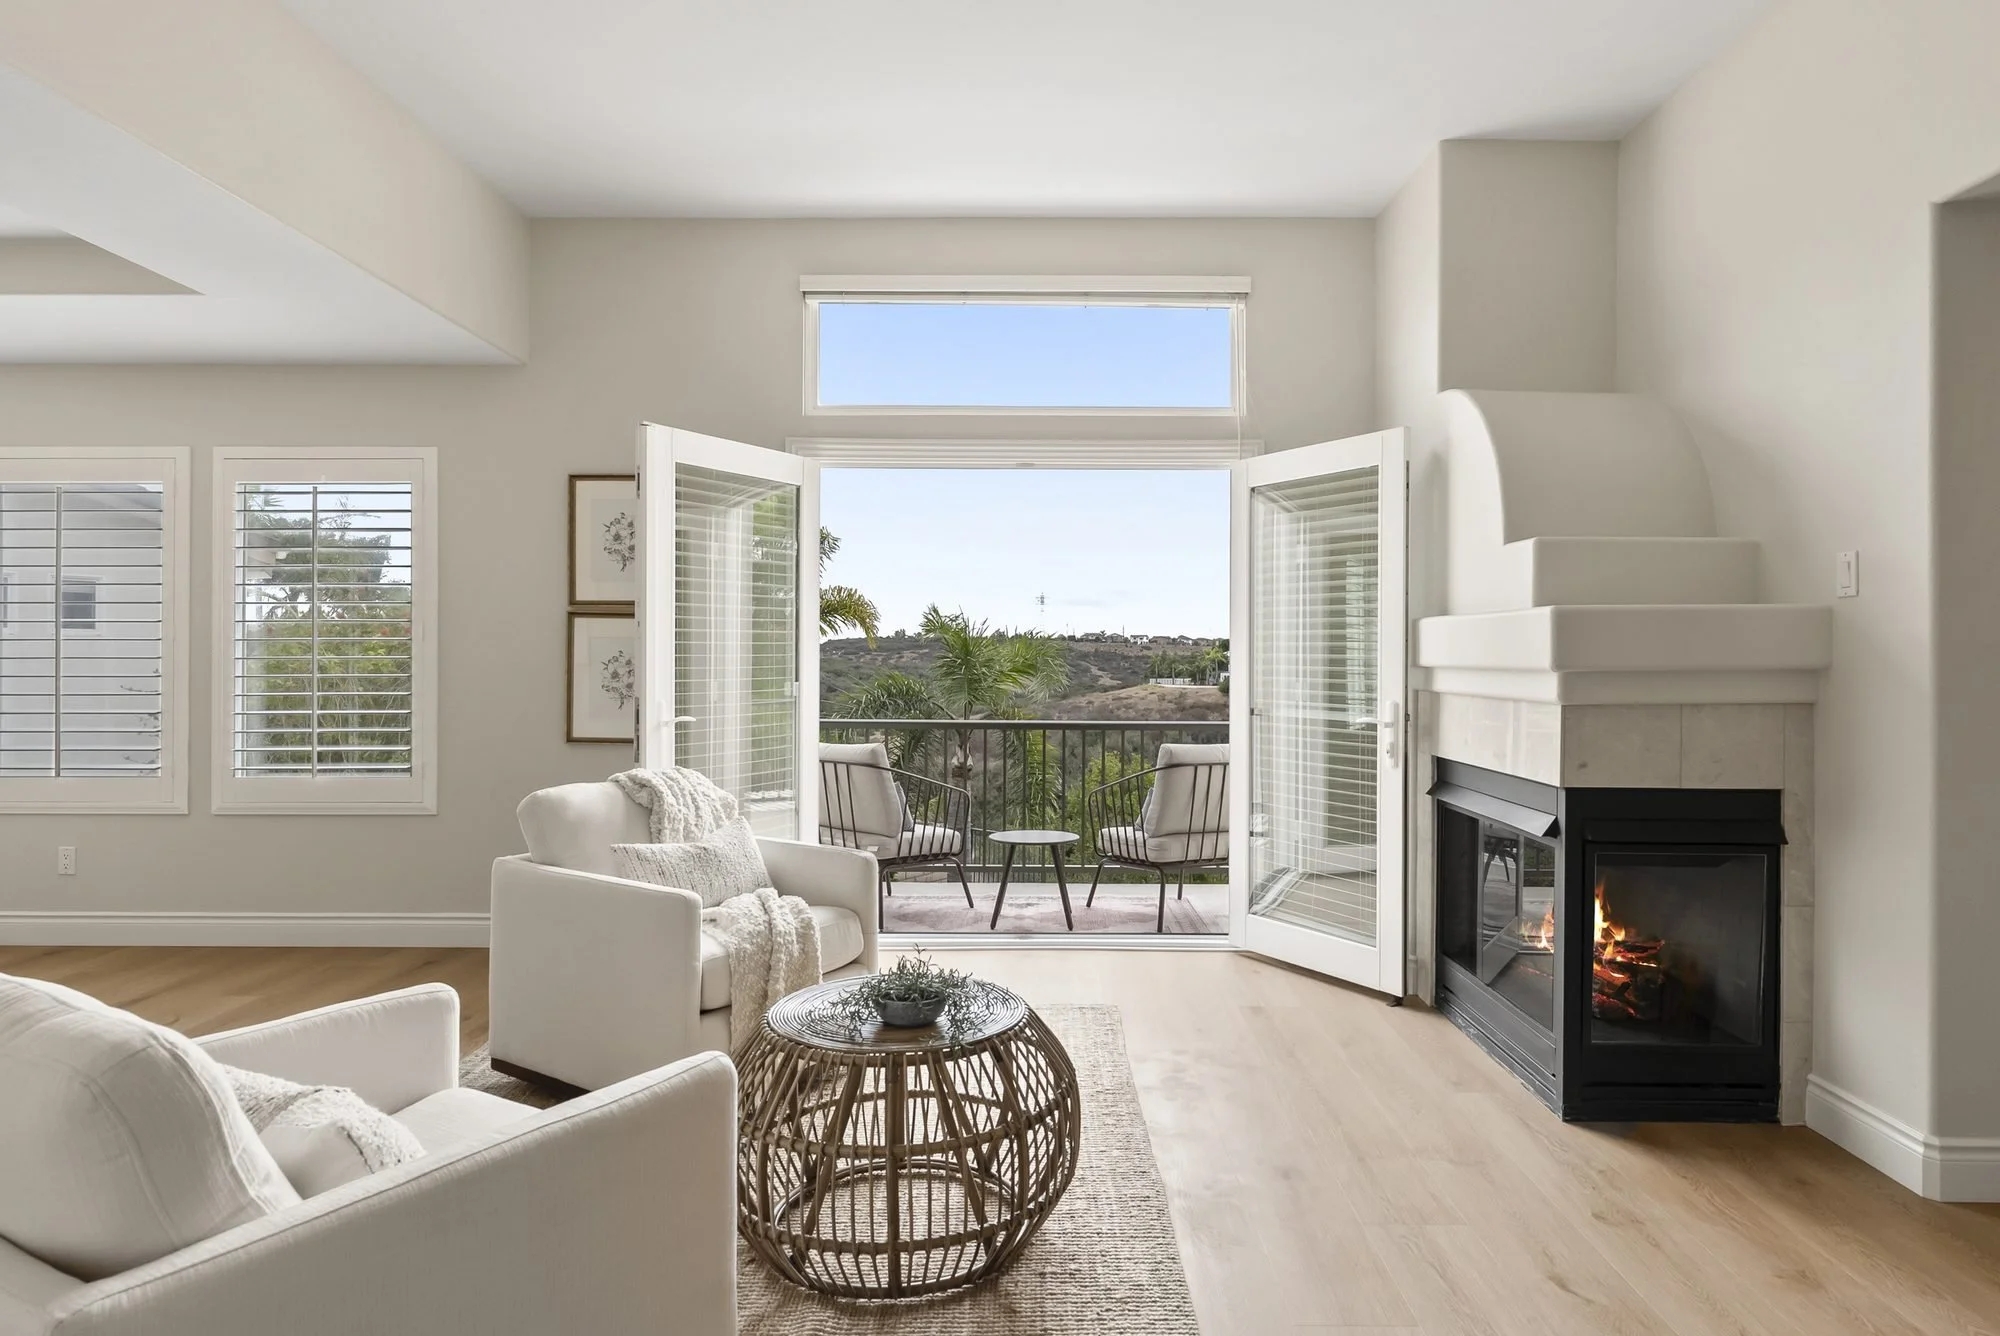
Staging helps buyers picture themselves in a home, as at 5439 Harvest Run Dr, where we styled the sitting area to open toward the view.
At CASA BY CRAFT, a pre-listing consultation is $350 to $500, occupied home staging starts at $3,000 and vacant home staging starts at $3,500 (plus tax). If you are wondering how those numbers are built, read Why Does Staging a House Cost So Much?, and for a look at what to avoid, read Cheap Staging Is Never Free.
Frequently asked questions
How has the San Diego housing market performed in 2026 so far?
Through September 2026, the San Diego County median sale price is $925,000, up 2.8% from the same period of 2025, and closed sales are 17,318, up 0.6%. Homes took an average of 39 days to reach an accepted offer, compared with 38 last year. Accepted offers fell 15.9% in September as mortgage rates rose. Source: SDAR September 2026 Monthly Indicators.
Is it a buyer's or seller's market in San Diego right now?
It depends on the type of home. In September, SDAR reported 2.4 months of supply for detached houses and 4.0 months for condos and townhomes, so lower supply still favors sellers of houses, while condos are more balanced. Overall, about one in five listings had a price cut in September, according to Realtor.com.
How does 2026 compare with 2025 in San Diego?
Very similar on volume and slightly higher on price. Year to date, the median sale price is up 2.8%, closed sales are up 0.6%, new listings are down 5.5% and average days on market are 39 versus 38. The bigger difference is mortgage rates, which are 7.40% now versus 6.27% a year ago.
How does 2026 compare with the 10-year average?
Prices are far higher, with the year-to-date median about 32% above the average of the last ten years. Closed sales are about 27% lower and days on market are roughly 10 days longer. These averages are calculated from SDAR's September reports for 2016 through 2025 and are not adjusted for inflation.
What are the forecasts for the San Diego housing market in 2027?
SDAR had not published a 2027 forecast that we could find as of October 2026. Zillow's forecast for the San Diego metro is for typical home values to rise 0.9% by September 2027, and the California Association of REALTORS® forecasts a 1.4% rise in the statewide median price in 2027. Forecasts depend heavily on mortgage rates, which range from 6.6% to 7.5% across the major forecasters.
What do higher mortgage rates mean for people selling a home in San Diego?
Higher rates shrink the pool of buyers who can afford a given price, which tends to mean longer marketing times and more price reductions. Sellers can respond by pricing accurately from the start and making sure the home shows well in photos and in person.
Is home staging worth it in a slower market?
Often, yes. In NAR's 2025 survey, 29% of sellers' agents reported a 1% to 10% increase in the dollar value offered and 49% said staging reduced time on market, though results vary by home and by how well the staging is done. At CASA BY CRAFT, occupied staging starts at $3,000 and vacant staging starts at $3,500 (plus tax).
Let's talk about your listing
CASA BY CRAFT is a San Diego home staging company serving agents and sellers across Downtown, Point Loma, Scripps Ranch, Coronado, North Park, Kensington, Mission Hills, La Jolla, Del Mar, Rancho Santa Fe, Solana Beach, Encinitas and Carlsbad. Planning a listing for this winter or next spring? Contact us for a consultation, browse vacant staging and occupied staging, or see our portfolio.
Expertly styled to stand apart.
Data notes: SDAR figures cover all residential sales in San Diego County from the San Diego MLS as of October 5, 2026. This article is for general information and is not financial or real estate advice. Talk with your agent about pricing for your specific home.
About the author
Morgan Craft is the founder and lead property stylist of CASA BY CRAFT and a Certified Real Estate Staging Professional staging San Diego homes since 2018. CASA BY CRAFT is The Staging Collective's San Diego metro member, and is also a member of the San Diego Association of Realtors (SDAR), the Kensington Talmadge Business Association and the Real Estate Staging Association. More about Morgan.